
Covid Analysis in Texas
Top test coverage counties - are the numbers real?
The numbers for test coverage (tests per 100,000 population) for some counties seem too good to be true.
So let’s look into them
Test numbers come from the State Health Department
| Top Ten Texas Counties for Test Coverage | |||||
|---|---|---|---|---|---|
| County | Cum_Tests | Population | Cases | Deaths | Coverage |
| Shackelford | 333 | 3311 | 0 | 0 | 10100 |
| Young | 267 | 18114 | 4 | 1 | 1470 |
| Wichita | 1581 | 131818 | 62 | 2 | 1200 |
| Martin | 53 | 5614 | 2 | 0 | 944 |
| Victoria | 854 | 91970 | 121 | 2 | 929 |
| Blanco | 103 | 11279 | 6 | 0 | 913 |
| Hamilton | 73 | 8269 | 5 | 0 | 883 |
| Potter | 974 | 120899 | 333 | 6 | 806 |
| Lubbock | 2367 | 301454 | 499 | 40 | 785 |
| Jackson | 115 | 14820 | 6 | 0 | 776 |
That certainly raises some issues. 10% of the population tested, and no cases detected? These numbers are from April 13.
For Shackelford county, if we look at the county website, there is a message about testing that states “as of April 13, 7 tests administered, 7 negative test results”. Hmmm…. Seven is a far cry from 333.
For Young county, the state has 267 tests, for about 1.5% coverage. The health authority, Pat Martin, was appointed March 17, as the position had been vacant since last year. On March 24 the county had 28 tests and one positive, but half of those were results pending. On the Graham Regional Medical Center Facebook page, it shows 335 tested, 324 negative, 6 positive, 25 pending as of 4/17. As far back as 4/9 they posted 284 tests. So some serious undercounting by the state. But good job by Young county. However, a death rate of 25% is worrisome. What is that about?
Wichita county. Very nice website, lots of current data. As of 4/17 they have 1717 tests, compared to the state 1581, pretty close.
Martin county. April 3 the county Facebook page shows 25 tests and zero cases.
Victoria county. Health Department Facebook page shows 92 Cases on 4/17, and on their page, from the press conference, they said 1080 tests had been done.
So really, with the exception of Shackelford, the numbers look okay. At least within reason.
But what about another extreme? What if there are more cases detected than were tested for?
| Top Ten Texas Counties for Cases per Test | |||||
|---|---|---|---|---|---|
| County | Cum_Tests | Population | Cases | positive_rate | Coverage |
| Andrews | 1 | 17818 | 19 | 19.00 | 5.61 |
| Sherman | 1 | 3058 | 14 | 14.00 | 32.70 |
| Moore | 24 | 21801 | 272 | 11.30 | 110.00 |
| Hockley | 2 | 23162 | 20 | 10.00 | 8.63 |
| Deaf Smith | 4 | 18899 | 25 | 6.25 | 21.20 |
| Mason | 1 | 4161 | 5 | 5.00 | 24.00 |
| Parmer | 1 | 9852 | 4 | 4.00 | 10.20 |
| Castro | 4 | 7787 | 13 | 3.25 | 51.40 |
| Donley | 10 | 3387 | 24 | 2.40 | 295.00 |
| Swisher | 4 | 7484 | 9 | 2.25 | 53.40 |
Andrews County Health Department website as of April 17 shows 84 tested, 19 confirmed. The state only shows one test.
Hockley county. As far as I can tell, no one has a clue as to how many tests have been done. The county judge complained on Facebook that she doesn’t even get told about positive results in a reliable way. It sounds like a hot mess.
Sherman county. County website only links to state website. Facebook page for Sherman County Emergency Management has some info, but nothing on testing. He seems to pull everything off the state website - I get the impression he is not in the loop.
Moore county. Worrisome story of county judge touting new antibody test. I hope he understands that that test is only useful after the fact - after it is clear you have it. April 15 report from Amarillo TV station shows 145 tests vs. 24 for the state numbers. The Moore county Hospital District shows 99 confirmed cases and 441 tests as of April 18.
So for a fair number of counties, the state test counts are far too low, and for some it appears that no one has a clue as to how nmany test have been run.
Hit rates for testing
So ignoring all the obvious issues with some of the test numbers, let’s look at another question. What fraction of people tested turn up positive? This number will likely fall with time, as testing criteria are loosened and more people are allowed to be tested, and should eventually stabilize somewhere near the fraction who are symptomatic, or somewhat above, assuming that only symptomatic and exposed people get tested.
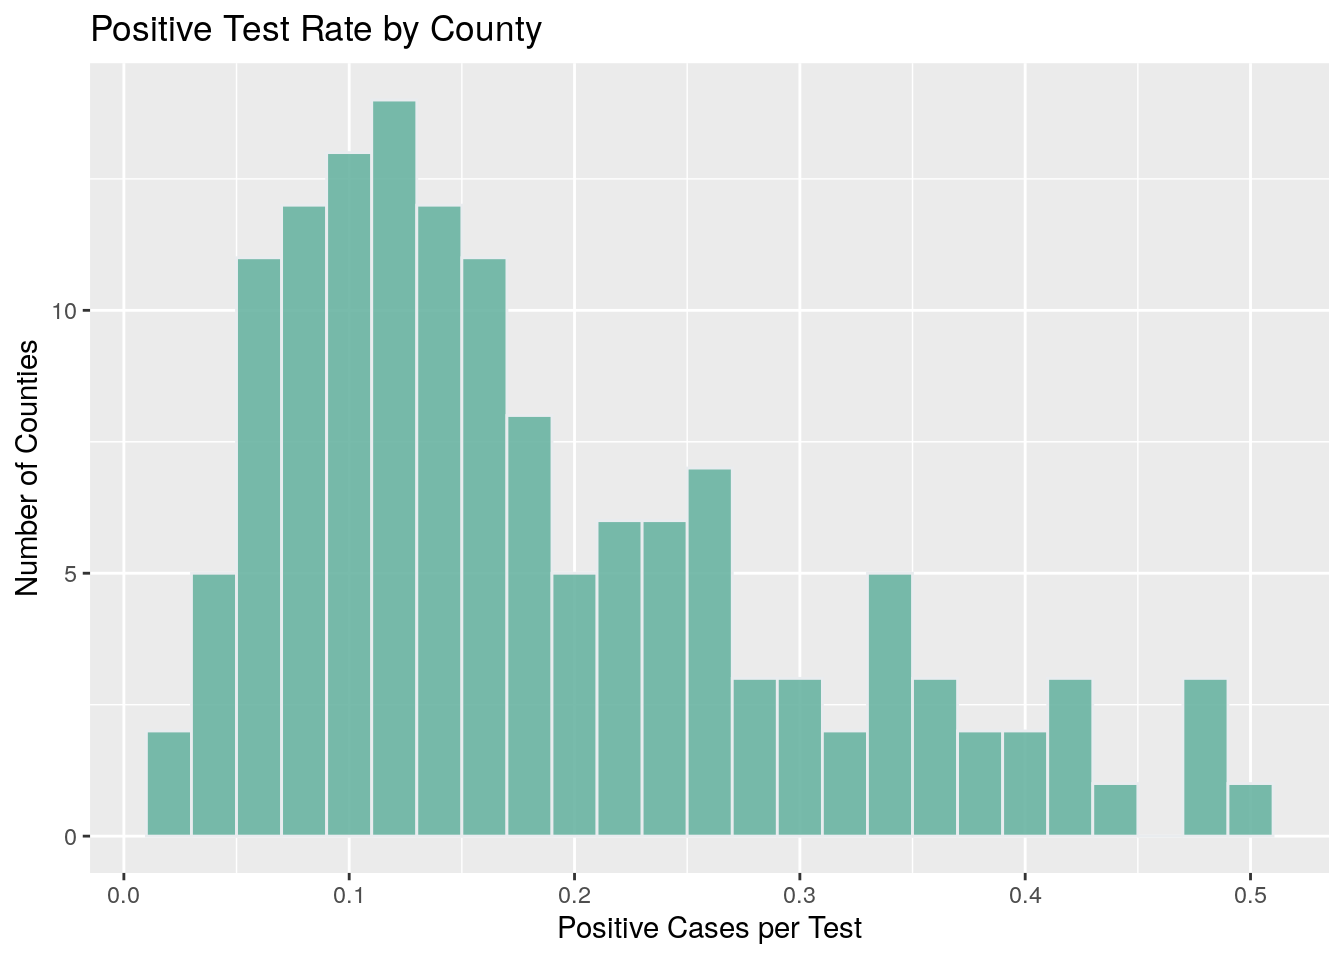
I don’t believe the tail on this histogram. To me those represent serious undercounting of tests, as I think I demonstrated for a few extreme cases above. What does seem believeable is that for symptomatic people getting a test, about 10% will turn up positive. I think that is a pretty good number. At least for places where the virus is relatively widespread.
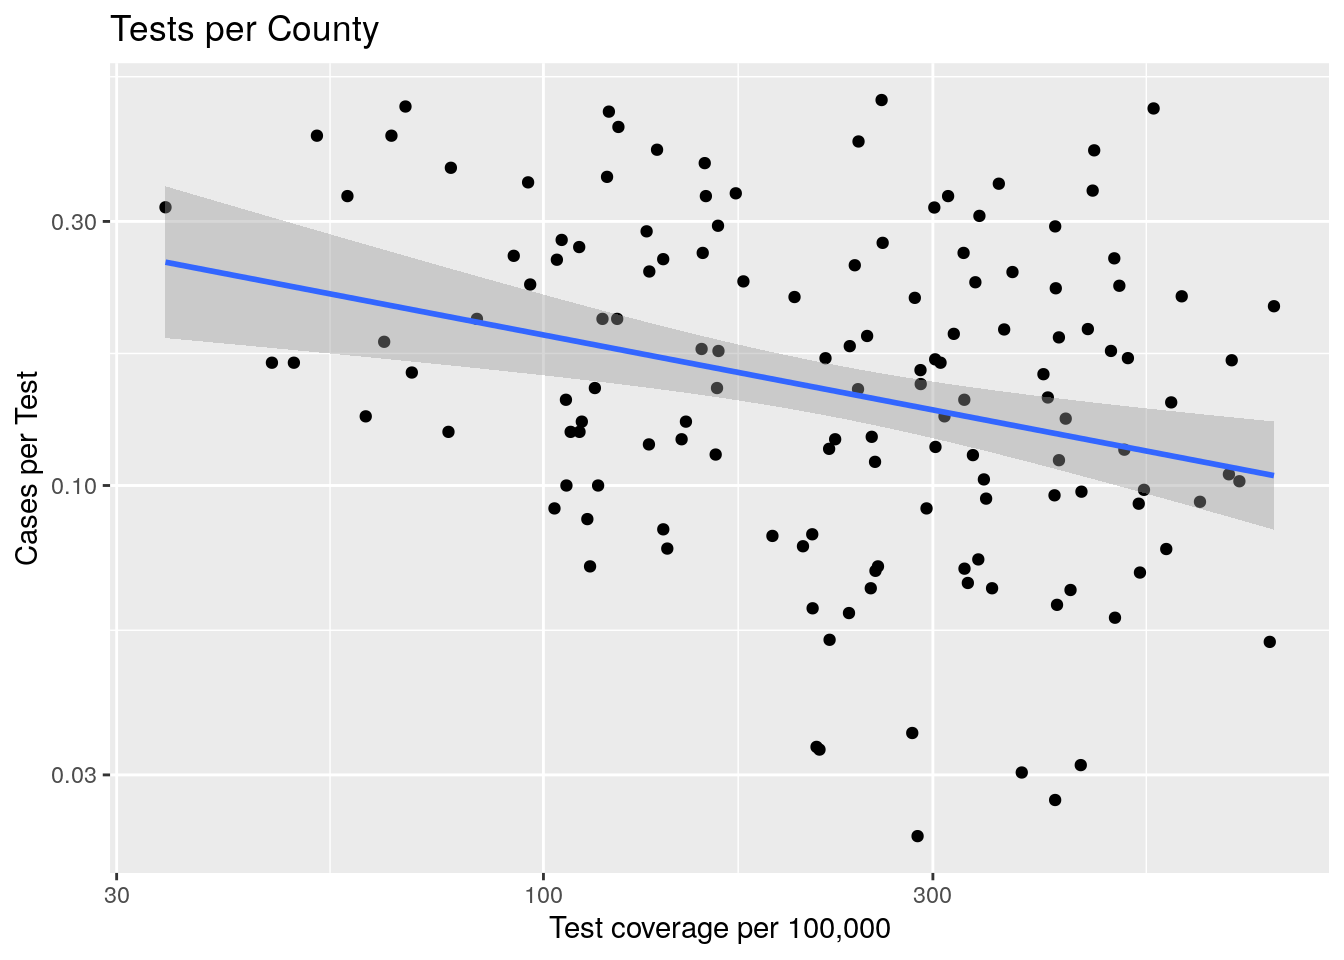
In this cut at the data we see a definite correlation between the number of cases found per test, and how complete the testing coverage of a county is. My interpretation is that for most of the left side of the plot, it is simply reflecting testing underreporting. I think the right half is probably closer to reality, and again we see that 10% positive is probably a useful rule of thumb.
So, testing is still a mess, which is very worrisome since fast, accurate testing is crucial for relaxing the stay at home orders, but I think some useful data can be gleaned.